A full calendar can still hide weak contribution, strained capacity, poor booking quality, and experience risk. Here is a practical way to tell whether your birthday program is becoming healthier – or merely busier.
A full party calendar is visible. Program health is not. For a family entertainment center (FEC), party count tells you how much activity moved through the program. It does not tell you whether completed events produced healthy revenue, whether incremental costs consumed that revenue, whether peak capacity was used well, or whether the guest experience can support future demand.
That does not make party count useless. It remains important for demand planning, staffing, scheduling, and sales. The mistake is asking one activity metric to answer a much larger business question. A birthday program can become busier without becoming healthier. It can also deliver fewer parties by design while creating stronger total value. The goal is not to prefer one model automatically; it is to measure the model you actually chose.
A useful starting point is contribution per party: the delivered-party net revenue that remains after the costs that genuinely vary with party activity. From there, operators can test labor and capacity strain, follow marketing performance past the booking, and watch experience signals that may be warning of future damage.
Why More Birthday Parties Do Not Automatically Mean a Healthier Program
Two venues can deliver the same number of parties and produce very different outcomes. One may rely on heavy discounts, oversized groups, frequent credits, and additional host coverage. The other may have a clearer package mix, steadier delivery, stronger food-and-beverage or add-on revenue, and less pressure on scarce weekend capacity. The count is identical; the economics and operating load are not.
Raw party volume, by itself, is not evidence of a healthy program. Deliberately designed high-volume/lower-price and premium/lower-volume models can both work. The problem is not volume. The problem is volume without a coherent economic and operating design.
A better measurement hierarchy: Activity -> delivered economic output -> party-level contribution -> constrained capacity and labor -> marketing quality -> experience and future-demand signals.
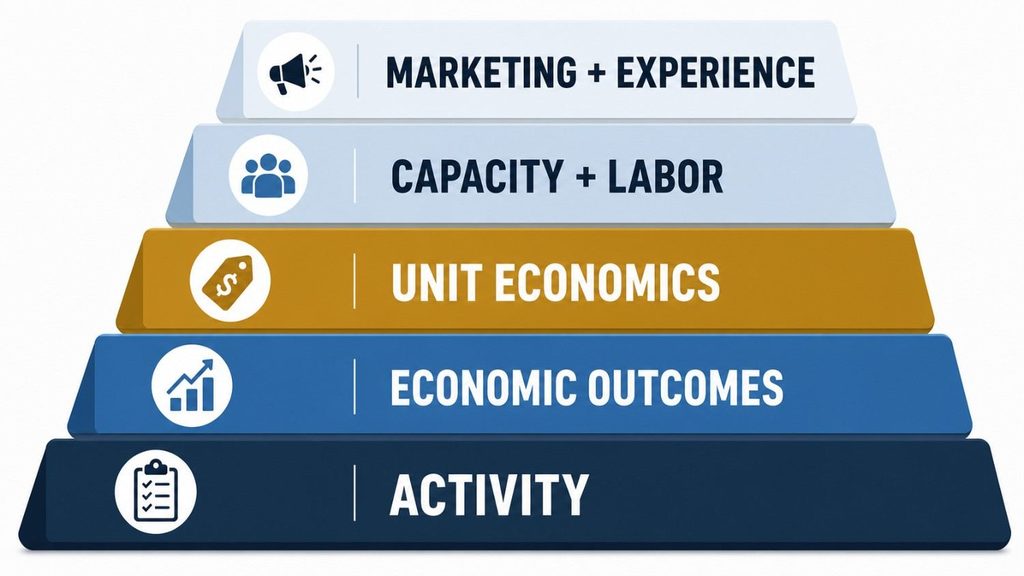
Figure 1. Birthday-program health requires more than party count alone.
The hierarchy matters because each layer answers a different question. Party count says whether activity changed. Delivered revenue says what completed events produced. Contribution says what remains to help cover fixed costs. Capacity and labor measures show whether the program consumed scarce resources efficiently. Marketing and experience measures explain why the economic result may improve or deteriorate.
Separate Bookings, Cash and Delivered Party Revenue
The first cleanup is definitional. A reservation, a deposit, and a completed party are not the same economic event. When they are blended into one number, operators can mistake future commitments or collected cash for completed performance.
A booked party is a confirmed reservation that meets the venue’s chosen commitment threshold. Booked party value is the current expected amount after known discounts but before final day-of changes. Cash collected is what the venue has actually received, including deposits and final payments. Parties delivered are the events that occurred and were completed. Delivered-party net revenue is the venue’s management measure of revenue from completed parties after discounts and refunds, excluding amounts that are not venue revenue under its accounting treatment.
The broader accounting principle is that revenue recognition follows the transfer of promised goods or services, not merely the receipt of cash; see IFRS 15’s revenue-recognition framework. Here, delivered-party net revenue is an internal management term, not a substitute for your accountant’s formal policy. Taxes, tips, service charges, deposits, refunds, and bundled components may require venue-specific treatment.
Keep booking-date and event-date reporting separate. If you are evaluating cancellations, delivery rate, or delivered revenue, use a consistent event-date cohort. Comparing this month’s cancellations with this month’s new bookings can produce a misleading rate because those parties may belong to different future periods.
Revenue-state flow: Inquiry -> confirmed booking -> cash or deposit collected -> party delivered -> delivered-party net revenue. Each state answers a different operating question.
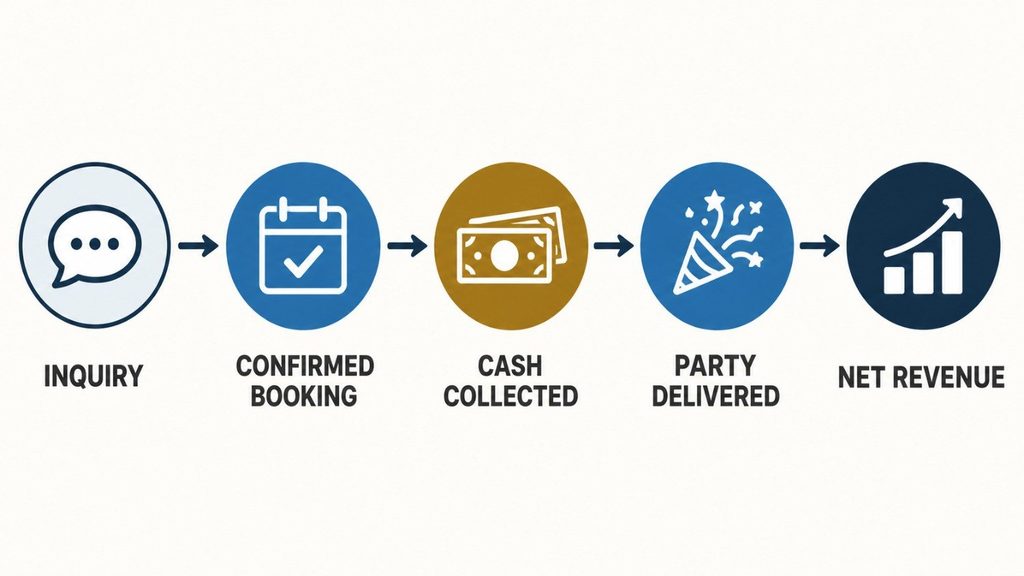
Figure 2. A booking, collected cash, delivery, and net revenue are different operational states.
Measure What Each Party Contributes, Not Just What It Sells For
Average party revenue is useful, but a high selling price can still hide weak economics. The next question is what the party contributes after the costs that genuinely change because the party occurred.
Delivered-party contribution = delivered-party net revenue – genuinely variable party costs
Contribution per party = total delivered-party contribution / parties delivered
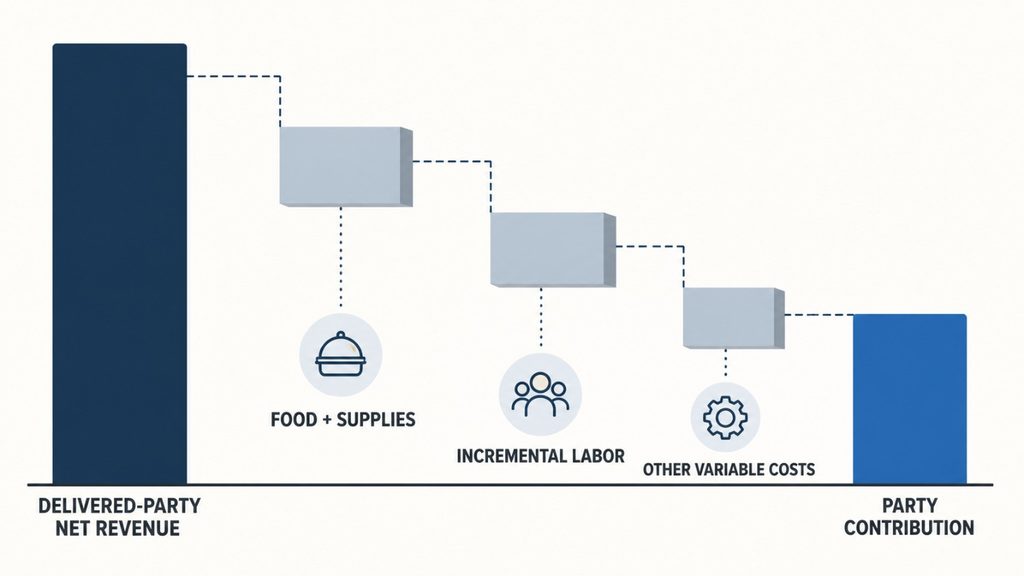
Figure 3. Party contribution is what remains after genuinely variable party costs.
OpenStax’s managerial accounting guidance defines contribution margin as sales less variable costs and explains that the remainder is available first to cover fixed costs and then contribute to profit. That is why contribution is not the same as net profit. A party can have positive contribution and still sit inside a program that does not cover rent, management salaries, insurance, software, depreciation, and other fixed or shared costs.
The difficult part is not the formula. It is the cost policy. Consumed food, party-specific supplies, and other costs that rise directly with party activity are common variable-cost candidates. Labor requires more care. A host already scheduled for the shift may not create an incremental cost when one more party is added. Overtime, an added host, an extra runner, or a new kitchen shift may be variable or step costs.
Cost behavior changes with the decision and the operating range. OpenStax’s cost-behavior overview notes that managers classify costs according to how the information will be used and distinguishes fixed, variable, and mixed behavior. For operators, the practical rule is simple: document what your venue treats as incremental, keep fixed and shared allocations separate, and apply the policy consistently.
Do not force every shared cost onto an individual party and call the result precise. Use contribution per party to understand incremental economics, then review program-level fixed costs separately. Also resist the temptation to publish or copy an ‘ideal’ FEC party margin. Venue format, package mix, labor model, food and beverage, price, and capacity are too different for one universal target to be defensible.
A Prime-Time Party Is Not Economically the Same as an Empty-Slot Party
Contribution per party is the lead outcome, but it is not always the final decision metric. A party using an otherwise empty weekday room can have different incremental economics from a party using the last available room during Saturday prime time. The first may use idle capacity. The second may displace another party, another event, or a more valuable use of the same resource.
This is where relevant range, step costs, and opportunity cost enter the discussion. A cost can remain fixed until activity crosses a threshold, then jump because the venue needs another host, supervisor, kitchen position, room reset team, or operating hour. A party that looks healthy inside the current staffing plan may look different after it triggers the next step.
Managerial accounting for constrained resources recommends comparing contribution with the scarce resource that limits output. Applied to birthday programs, that suggests a high-value conditional metric:
Contribution per constrained room-hour = party contribution / constrained party-room hours consumed
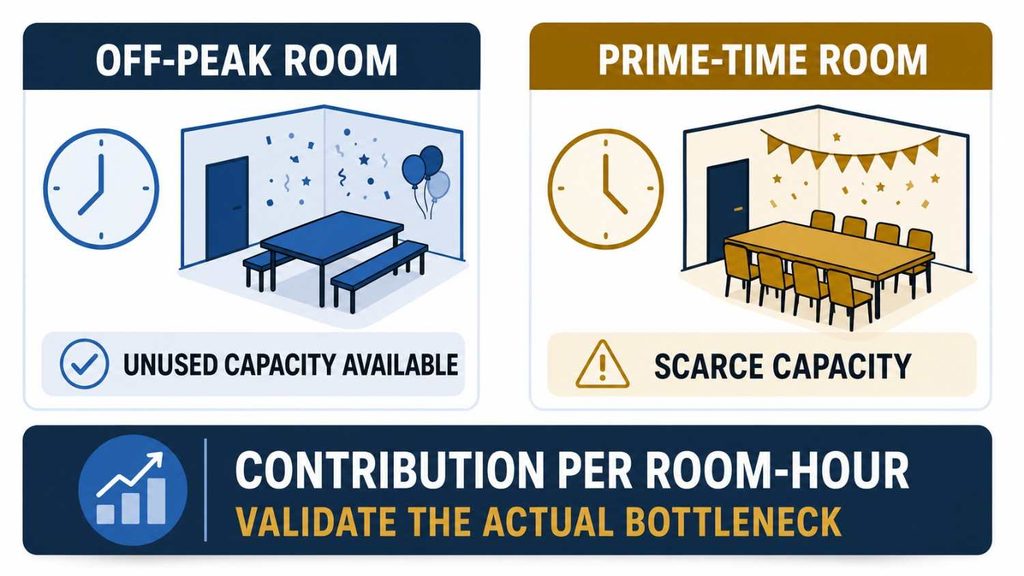
Figure 4. When capacity is scarce, compare contribution per room-hour after validating the actual bottleneck.
Room-hour is a useful starting lens because party rooms often shape the schedule. It is not a universal bottleneck. Your real constraint may be trained hosts, attraction capacity, kitchen throughput, parking, check-in, waivers, or another resource. Validate the bottleneck before building decisions around the denominator. If the room is not scarce, room-hour productivity may be interesting but not decisive.
This does not mean off-peak parties should be cheap or that peak parties should always cost more. Pricing strategy belongs in a separate decision. The measurement point is narrower: when capacity is constrained, operators should know how much contribution each use of that scarce capacity produces and what alternative use it may displace.
Marketing Should Follow the Party Past the Booking
A marketing report that stops at leads or confirmed bookings can reward the wrong outcome. One source may generate many inquiries that cancel, require aggressive discounts, arrive in low-value time slots, or produce weak delivered contribution. Another may generate fewer bookings but stronger delivery, mix, and economics. That is why measurement should connect marketing activity to downstream revenue rather than stop at lead or party volume.
Marketing-to-contribution chain: Source -> inquiry -> confirmed booking -> party delivered -> delivered-party net revenue -> contribution. Mark the points where phone calls, cross-device behavior, assisted bookings, and missing identifiers weaken attribution.
If paid-acquisition data are credible enough, cost per delivered party is more useful than cost per lead or cost per booking. The stronger long-term objective is attributed contribution: the contribution from delivered parties that can reasonably be linked to a source. But attribution is never automatically complete, and contribution-to-ad-spend is not company ROI or net profit.
The data plumbing is increasingly practical. CenterEdge describes event records, payments, revenue allocation, cost centers, deposits, scheduling, and capacity features, while Party Center Software describes reports for bookings and revenue plus schedule blocks built around staff, hours, and space. Those are vendor capability claims, not proof that a platform automatically produces accurate party contribution. Operators still need definitions, source IDs, cost rules, and reconciliation across booking, POS, payroll, CRM, and accounting systems.
Watch Experience Signals Before They Become Financial Damage
Short-term economics can look acceptable while delivery quality deteriorates. Refunds, credits, formal service recovery, late starts, missed food timing, labor strain, expectation failures, and recurring review themes should be watched alongside contribution. These signals can tell you where the operating system is under pressure before a financial summary explains why.
Treat them as diagnostics, not proven financial predictors. A complaint log is not a causal model, and a review theme should not be assigned a dollar value without evidence. Code what happened, how serious it was, where in the party journey it occurred, and whether recovery was required. Then investigate whether the pattern coincides with a package, time slot, staffing configuration, booking source, or expectation gap.
This is also why scaling demand before fixing execution can be dangerous. Attractions Marketing Pros explores that broader operating principle in Broken Windows: The FEC Customer Experience Problems That Marketing Cannot Fix. More bookings do not repair a broken handoff; they usually expose it more often.
The Minimum Birthday Scorecard for an Operator Without Perfect Accounting
You do not need a perfect cost system to stop relying on party count alone. Start with a small scorecard that distinguishes activity, delivery, economic output, capacity, acquisition quality, and experience. Use the same event-date cohorts and the same written definitions every reporting period.
| Measure | Definition and decision use | Guardrail |
| Parties booked / parties delivered | Track confirmed reservations separately from completed events. The gap exposes cancellations, no-shows, or status problems. | Do not treat a booking as delivered revenue. |
| Cancellation rate | Cancelled confirmed parties divided by parties scheduled in the same event-date cohort. | Do not mix current cancellations with current new bookings. |
| Delivered-party net revenue | Completed-party revenue after discounts and refunds under the venue’s management policy. Also track average delivered-party revenue. | Exclude amounts that are not venue revenue under the applicable treatment. |
| Variable party cost | Costs that genuinely rise with party activity within the documented relevant range. | Keep fixed/shared allocations separate; define labor behavior carefully. |
| Contribution per party | Delivered-party net revenue less variable party costs, divided by parties delivered. Optional: contribution-margin percentage using the same definitions. | Contribution is not net profit and does not include every fixed cost. |
| Direct labor / step-cost flags | Party-specific setup, hosting, food service, reset, overtime, or added-staff indicators under the venue’s policy. | Scheduled labor may be fixed within a shift; overtime or added hosts may step up. |
| Contribution per constrained room-hour | Party contribution divided by scarce party-room hours consumed when the room is the actual bottleneck. | Validate the bottleneck; substitute the true constrained resource if needed. |
| Cost per delivered party | Attributable paid spend divided by delivered parties linked to that source. | Use only when source matching is credible; disclose attribution gaps. |
| Experience indicators | Refunds, credits, service recovery, late execution, expectation failures, labor strain, and coded review themes. | Use as diagnostics, not quantified predictors of future revenue. |
Minimum scorecard: no target ranges are implied. Definitions must be documented and applied consistently.
This is intentionally not a complete dashboard. A mature measurement system may add package mix, add-on revenue, inquiry-to-booking conversion, referral and repeat behavior, ownership, reporting cadence, alert thresholds, and detailed decision rules. The minimum scorecard exists to answer one question first: is the birthday program becoming economically and operationally healthier?
What to Investigate When One of the Numbers Moves
Metrics become useful when they trigger a disciplined investigation. Avoid reacting to one number in isolation. Start with the outcome that changed, then move down the hierarchy to find the likely cause.
- If party count rises but total contribution or contribution per party falls, check package mix, discounts, refunds, party size, food and add-ons, genuinely variable costs, and whether the added volume triggered overtime or another step cost.
- If bookings rise but delivered parties do not, inspect cancellation rules, booking quality, event-date cohorts, deposit thresholds, source mix, and whether the booking system is overstating confirmed demand.
- If contribution per party is stable but peak operations feel worse, look at contribution per constrained room-hour, host coverage, kitchen throughput, late starts, reset time, and the point at which another staffing or capacity step is required.
- If one marketing source produces strong booking volume but weak delivered contribution, compare cancellations, discounts, package mix, party size, refunds, and delivery status by source. Confirm that identifiers survive phone and assisted bookings before drawing a conclusion.
- If delivered revenue rises while service recovery and expectation failures rise, investigate whether price, package promises, staffing, capacity, and the onsite party journey still match. Revenue growth that depends on repeated recovery is not a stable operating model.
- If party count falls while contribution per party or per constrained hour improves, do not declare success or failure from either number alone. Review total contribution, unused capacity, customer mix, future demand signals, and whether the change reflects a deliberate model or an unintended loss of demand.
The goal is not the most parties or the fewest parties. It is a deliberately designed program that produces healthy contribution, uses constrained capacity intelligently, attracts economically useful demand, and delivers an experience the operation can sustain. That is the difference between a birthday program that is busy and one that is healthy.